Top 25 Lean Manufacturing Tools
- By Brett Griffiths
- Lean Technology
- May 30 , 2024
- Share
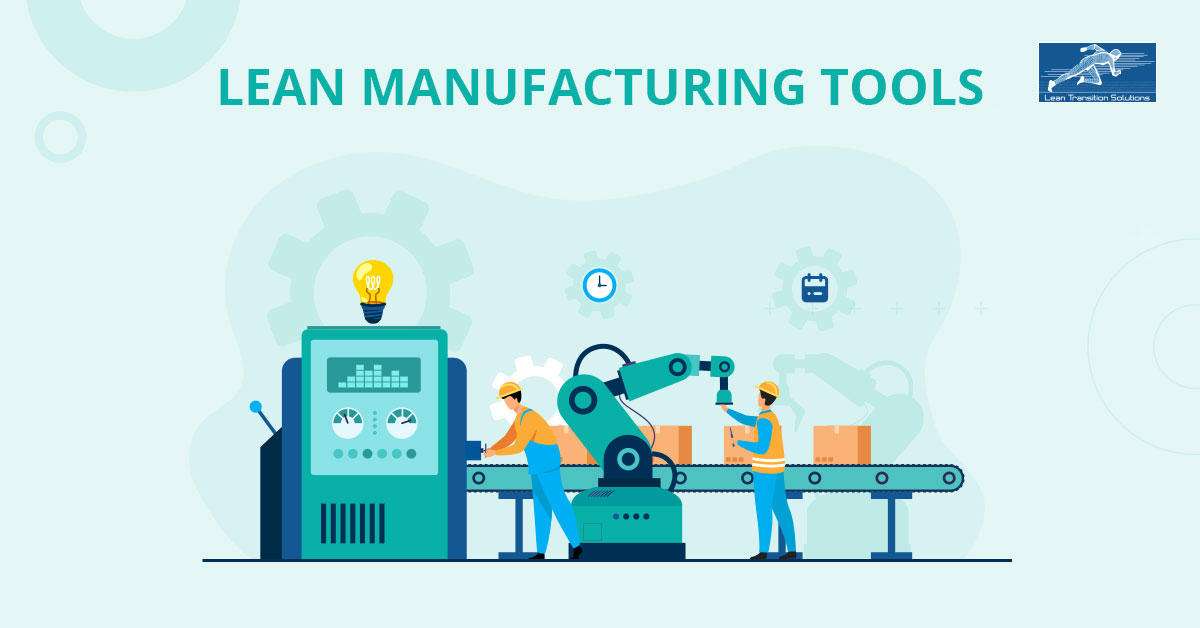
"Lean isn't Lean if it doesn't involve everyone." — John Shook. Lean manufacturing methodology needs a comprehensive approach for its effective implementation. Lean as a concept is to be practised by everyone coming in contact with the product's supply chain, whether on the planning or the analytical side. Lean manufacturing tools facilitate continuous improvement in production efficiency and product or service quality. Lean tools aim to reduce Muda or the wastes in the production industry ranging from the scraps in the production process to the waste of unused employee creativity. Now let's delve into some of the significant lean tools,
1. KAIZEN
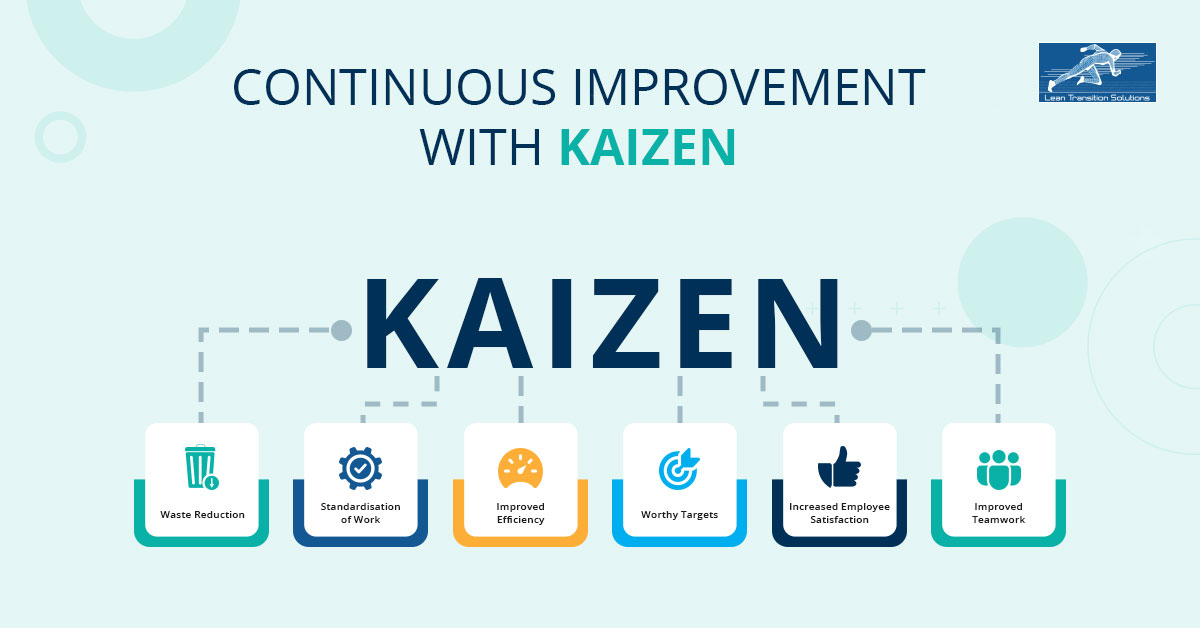
Kaizen is a Japanese business philosophy that continuously aims to improve the operations and employees in the organisation. The ultimate goal of Kaizen, as its name suggests, is to have "change for better", whether the change is big or small or rapid or slow. Even the small changes happening at a crawling pace can impact the long run. Every stakeholder is expected to contribute to the company's success through Kaizen. The main advantages of Kaizen include
-
Waste reduction
-
Standardisation of work
-
Improved efficiency
-
Worthy targets
-
Increased employee satisfaction
-
Improved teamwork.
The implementation of Kaizen involves the following steps:
-
Identifying the area of the problem
-
Studying how the current system works
-
Evaluating and testing the proposed improvement
-
Collecting feedback.
2. JIDOKA
Jidoka, also called autonomation, is automation with human intelligence. Here, the work stops immediately at the faulty level, which helps identify the root cause of the problem. The concept of Jidoka originated in the 1900s. It was first used by Sakichi Toyoda, the founder of the Toyota group, when he founded a textile loom that broke automatically when the thread broke rather than producing faulty fabric. The process involved in carrying out Jidoka includes identifying the issue or the problem, stopping the procedure followed by fixing it and identifying the primary cause of the problem to avoid future complications. The benefits of Jidoka include:
-
Maintaining the excellent quality of the product.
-
Making the process more dependable, responsible and authorising the employees.
-
Preventing equipment breakdown.
-
Eliminating overproduction.
3. POKA YOKE
Poka-Yoke translates to mistake-proofing. Poka-Yoke arose from the understanding that mistakes are inevitable and the system needs to be set up for early detection and avoidance. Poka-yoke tries to prevent the mistake by ensuring the proper condition before executing the process. When not possible, they play a detective function of identifying the error in the process and rectifying it before it reaches the consumer. Significant advantages of poka-yoke include:
-
Higher productivity
-
Reduced waste
-
Continuous improvement
-
Improved safety
4. KANBAN
Kanban in Japanese translates to a signal card or a graphic card. These signal cards work as the indicators to refill an item that is running low in stock, and when the signal card or Kanban is raised, the necessary things are filled in the required quantity. Kanban thus helps to reduce the wastage of time, extra cost and space of storage by ordering what is only needed, which in turn helps in increasing the company's profit. Kanban is mainly implemented according to the consumer demands, so the chances of committing mistakes are more diminutive and prevent faulty stock from entering the downstream customer processes.
The Tcard Kanban board offers teams a visual management system for handling project tasks, mapping workflows, and refining work delivery processes. Kanban Boards in the Digital Tcards serves as a consolidated platform for optimising work distribution among multiple teams. Each Tcard board visually outlines the different stages of a process, where cards symbolise individual work items and columns delineate each stage's progression. This visual approach facilitates effective task management and communication within teams, offering a comprehensive overview of workflow dynamics.
5. CONTINUOUS FLOW
Continuous flow is closely associated with the other lean tools such as Kanban and Just in Time. Continuous flow makes sure that every single item is moved through all the steps in the process instead of a group working into batches. Here the work is carried out smoothly, and there is a little hindrance between the manufacturing stages. Continuous flow ensures that the goods are continuously being sent to the consumers, and it adds value to the consumer as the waiting time of the consumer is reduced. It also ensures continuity and stability in the production process and reduces waste products.
6. KEY PERFORMANCE INDICATORS (KPIs)
KPIs are measuring tools used to analyse the progress of production efficiency in the industry. The successful implementation of the lean manufacturing tools and their work is being carried out with the help of Key Performance Indicators or Improvement priorities. The target vs Actual or the Plan vs Goal approach is the easiest way to measure business performance.
The leading indicators indicate the targets are being achieved successfully and can drive the company into success in the future. In contrast, the lagging indicators show the company's past glory and where the plan needs to be regrouped to achieve the desired results.
Some of the common KPIs include:
-
Strategic measures:Tracking the progress of the strategic objectives whether they will be able to produce the intended outcomes
-
Operational Measures:Tracking the operational efficiency of the system
-
Project Measures:Measuring project progress and performance
-
Risk Measures:Identifying the risk factors and eliminating them
-
Downtime:Time taken for a machine changeover or time lost in the machine breakdown
Integrating Balanced Scorecard methodology with KPI can enhance performance evaluation and strategic decision-making. Key Performance Indicators being the fundamental metrics that gauge an organisation's success in achieving its objectives, it systematically tracks and monitors these quantifiable measures from where businesses can assess progress and make data-driven adjustments to their strategies. The SQCDP framework in balanced scorecard provides a comprehensive analysis of KPIs across different organisational departments, offering insights into both short and long-term goals. This holistic approach ensures that every facet of the business aligns with overarching strategic objectives, driving collective progress and growth.
7. TOTAL PRODUCTIVE MAINTENANCE (TPM)
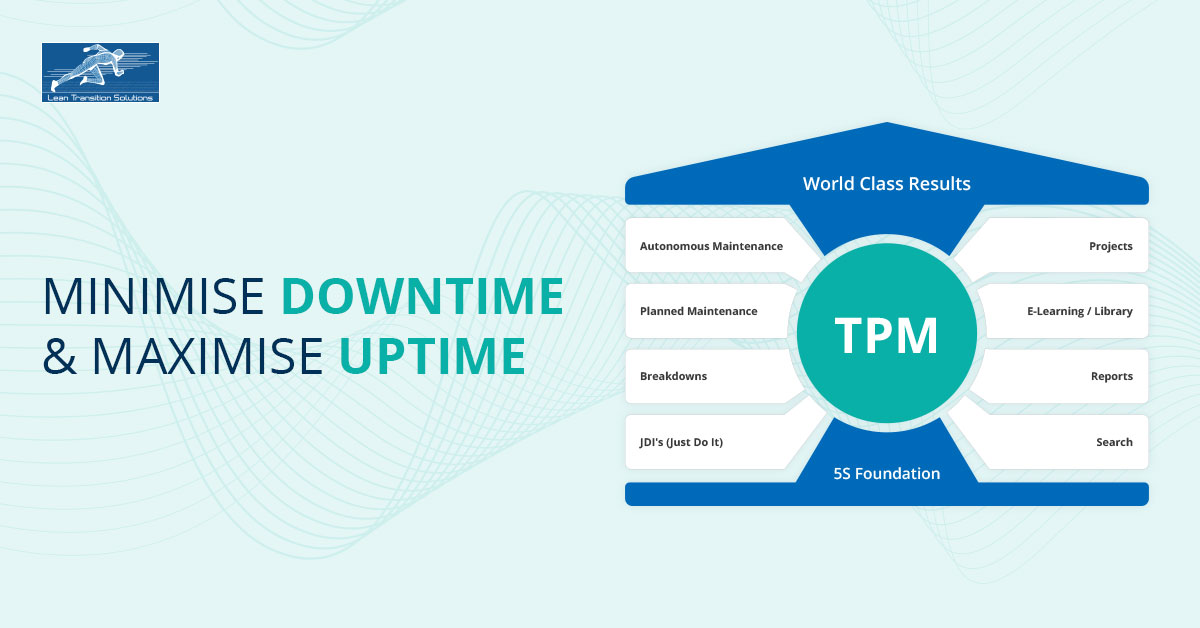
TPM aims to reduce the machinery's downtime and increase the production system's operational efficiency. Focus is mainly on the increase in production by maintaining the reliability of the production equipment. TPM tries to avoid breakdowns, slow processes, defects or accidents. TPM works on Preventive Maintenance, Corrective Maintenance and Inbuilt Maintenance.
Preventive maintenance involves maintenance of the machinery being scheduled regularly. In contrast, Corrective maintenance checks the equipment altogether and replaces it with the new one to avoid the additional cost of repair every time. Inbuilt Maintenance or maintenance prevention component makes sure no extra equipment is purchased. The ones purchased are in the proper working conditions and of good quality to avoid the additional charge of repairing or replacing them when the production efficiency is affected.
Other operations related to maintenance activity include autonomous maintenance, daily check, external maintenance, focused improvement, planned maintenance, quality maintenance, planned repair etc. TPM tries to create the shared responsibility of the equipment, which will help to increase the involvement of the workers and increase productivity.
A CMMS software revolutionises maintenance management by offering a comprehensive solution that maximises operational efficiency and minimising downtime, in line with the principles of Total Productive Maintenance (TPM). With CMMS software, you can seamlessly streamline maintenance tasks, optimise operations, and enhance overall productivity. By integrating TPM methodologies into its features, such as real-time maintenance data, preventive maintenance scheduling, and customisable reporting capabilities, CMMS software empowers businesses to reduce equipment downtime, lower maintenance costs, and extend the lifespan of critical assets.
8. TOTAL QUALITY MANAGEMENT(TQM)
TQM, just like TPM, is one of the lean tools that increase the system's operational efficiency. While TPM concentrates on the equipment and product, TQM mainly focuses on the end product and its quality.
The main principles of TQM involve
-
Customer Satisfaction: "The customer is King" customer feedback defines the success and failure of a product. Therefore, the company constantly undergoes a continuous improvement process to satisfy the customer.
-
Continuous Improvement: The company always analyse the production process and develop innovative ways to tackle the competition and meet customer expectations.
-
Strategic and Systematic Approach: TQM uses a strategic management approach to attain the company's set goals and vision without compromising the quality of the product.
-
Process Centred: Process here refers to the steps carried out from the initial planning stage of the product to the final customer delivery. TQM ensures that these processes are monitored and analysed consistently to maintain the efficiency of the production system.
9. HEIJUNKA
Heijunka is the process of level scheduling. Heijunka levels the type and quantity of production and reduces batching. Heijunka tries to maintain evenness in the production system, and the orders are processed according to the customer demands. This tool helps reduce the number of products kept in reserve during the low market and maintain a minimum number of products when the demands increase. Heijunka's goals include reducing inventory, processing time, and capital costs
10. ANDON
Andon is a visual response system that demonstrates the status of the production. This visual management tool alerts the operators in the case of an abnormality or problem and empowers them to cease the production process without waiting for the top management. Andon has its origin in the Jidoka methodology. Different coloured Andon lights signal various problems and actions required to resolve them. Andon increases transparency and efficiency in the process and reduces waste.
11. OVERALL EQUIPMENT EFFECTIVENESS (OEE)
Like KPI, OEE is another lean manufacturing tool that measures the manufacturing industry's productivity. OEE score of 100% means that the production system works perfectly with manufacturing the right amount of the products at the right time in the needed numbers and good quality with zero downtime. The key factors that are needed for the measurement are:
-
Quality: Measures the number of defects like product rejections, reduced yields etc.
-
Performance:Measures slow cycles and minor stops, and 100% performance indicates that everything is running efficiently
-
Availability: This measure considers all factors that can stop production for a considerable time. It can include planned stops like changeover time and unplanned stops like downtime or material constraints.
Enhance production efficiency with the implementation of a robust data capture system to calculate Overall Equipment Effectiveness (OEE) and optimise manufacturing output. This system analyses asset availability, performance, and production quality to gauge process efficiency accurately. By capturing real-time data, it provides insights into underperforming machines, enabling proactive measures to improve machine efficiency and maximise overall productivity. OEE, derived from the multiplication of availability, performance, and quality metrics, serves as a comprehensive indicator of manufacturing performance, guiding strategic decisions towards operational excellence.
12. 5S
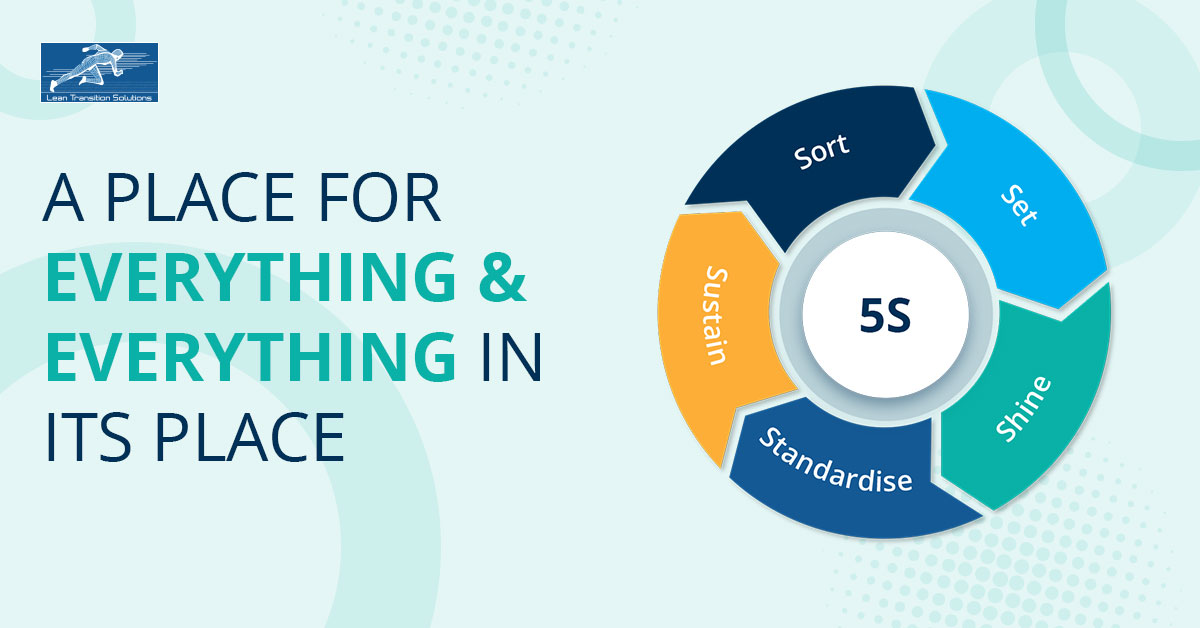
The 5S concept was introduced by the Toyota Production System(TPS) in the mid 20th century, which mainly focuses on the workplace. It involves comprehensive cleaning, decluttering and organising the workstation to maximise productivity and minimise waste creation. The 5S stands for:
-
Sort (Seiri): Categorise essential and nonessential components and remove the unneeded parts.
-
Set in Order (Seiton):Ensuring that each item is placed in the correct place for ease of use.
-
Shine (Seiso):Cleaning up the workstation so that the debris is removed and identifying the error in the system becomes easy.
-
Standardise (seiketsu):Creating a set of standards for Seiri,seiton and Seiso to work in proper condition.
-
Sustain (shitsuke):Maintaining and sustaining the above 4S practices so that the 5S tool can meet its long term goal.
Ensure continuous improvement through the agile, efficient, and effective 5S audit process, evaluating the organisation's 5S implementation. With regular audits, track performance trends and implement action plans to address anomalies swiftly. Streamline audit creation and assignment, complete with notifications and reminders for employees, fostering increased engagement and productivity. Experience simplified, organised data flow for every audit, enabling easy tracking and informed decision-making.
13. BOTTLENECK ANALYSIS
Bottleneck or constraint refers to the resource that takes the longest time in operations in the production industry. Bottleneck analysis tool in the lean manufacturing industry helps in the identification of the slowest process in the system and figure out steps to improve them so that the efficiency of the production system is maximised,
The main objectives of the analysis include:
-
Identifying bottlenecks in the production as well as the managerial positions
-
Collecting relevant quantitative data for the analysis
-
Researching for the possible solutions to tackle the bottlenecks
-
Increasing quality of the product, maximising worker efficiency and reducing downtime.
14. JUST IN TIME (JIT)
The lean manufacturing concept is directly linked to Just in Time manufacturing, where the main aim is to reduce waste generation. Just in time calls for the production of products according to the customer demands as in what quantity they need, when they need it and where they need it. It avoids the overproduction and stocking of the products in the warehouses and shuns away from the extra cost of inventory, storage and labour.
15. GEMBA
The meaning of the term is a real place. Here the idea is that the higher authorities or the management must go to the shop floor and see how the process is being carried out. The physical presence on the work floor increases the transparency in the process. It builds a trust level between the workers directly involved in the production process and the higher-level management. The process involved in the Gemba walk can be summarised as follows. The leaders directly observe the process, collect necessary information, understand the process involved, ask the workers, identify the problems, and bring out the solutions.
The Gemba walk template serves as a structured framework for conducting Gemba walks, a cornerstone of lean manufacturing principles. This template provides guidelines and prompts for leaders to observe, engage, and identify opportunities for improvement directly on the shop floor, where value is created. By focusing on real-time observation and interaction with frontline workers, the Gemba walk template facilitates the gathering of valuable insights into processes, operations, and potential areas for optimisation. It ensures that Gemba walks are conducted consistently, effectively, and with a clear focus on driving continuous improvement throughout the organisation.
16. TAKT TIME
Takt time is closely associated with the Just in Time Concept. It is the time required to produce a product while still meeting the consumer demand. It can be calculated as
TAKT TIME = PLANNED PRODUCTION TIME/CONSUMER DEMAND
Significant goals of takt time include
-
Continuous flow of operations within the supply network
-
Consistent pace of production
-
Reduction in waste generation
-
Cost-effective as the overproduction and storage cost etc. are avoided
Takt time can be demonstrated with the help of an example. Suppose the customer demand an average of 20 products a day, the total production hours set as 8 hrs (8*60= 480 mins),
Takt time can be 480/20 = 24 mins
That means that every 24 minutes, a product is produced.
17. SMART GOALS
Smart Goals is an effectively used lean tool that helps to set up goals. These productive goals must be effectively communicated across the organisation for proper implementation. SMART here stands for;
Specific: The level of specificity determines the possibility of achieving the goal.
Measurable:Targets are clearly defined in quantity.
Attainable:The targets should be achievable and realistic. Keeping the expectation level high does not always do good for effective working.
Relevant:the goals should be appropriate and in line with the organisational goals.
Time Specific: Reasonable deadlines should be made after analysing the company's existing time and material availability conditions.
18. PDCA
PDCA stands for Plan - Do -Check- Act. PDCA approach aims for continuous improvement in the production system.
Plan: Identify the improvement area, whether the existing production system or a new product or service.
Do: Plan is executed under a controlled environment and generally on a small scale anticipating unforeseen exigencies.
Check: This stage forms the most crucial part of the approach. Here the test results are being analysed and studied if the proposed plan worked out. The defects in the system and the root cause for the problem are identified in this stage.
Act: Act is the final step of the process. Action depends upon the conclusions from the previous steps, and if the expected plan has worked out and produced the desired results, the plan becomes the standard baseline. If the expected outcome is not delivered, the entire procedure is redone.
19. SINGLE MINUTE EXCHANGE OF DIE (SMED)
The main goal of SMED is to reduce the changeover time to single digits, like less than 10 minutes. SMED converts as many equipment changeovers to an external set-up so that the changeover time is reduced as the process is done while the equipment is still running. Steps included in SMED are:
-
Separate internal from external operations and convert setup into external
-
Simplify the internal setup
-
Standardising functions
-
Elimination of work instructions
20. SIX BIG LOSSES
Six big losses include six significant reasons for productivity loss in the manufacturing industry. TPM and OEE are directly linked to this tool and help to identify and eliminate these losses. The Six Big Losses can be categorised as follows:
Availability Losses
-
Equipment failure or breakdown: The broken-down equipment that needs intensive maintenance accounts for the loss and is an unplanned stop.
-
Setup and adjustments: This planned stop can incur loss due to the equipment changeover or any other adjustment needed.
Performance Losses
-
Idling or minor stop: The equipment stops for a short period and is resolved by the operator after a few minutes. Examples of this include material jams, obstructions, quick cleaning etc.
-
Reduced speed or slow cycles: The equipment runs slower than the ideal set time, and the performance is affected
Quality Losses
-
Defective Process: This refers to the faulty parts produced during the normal working conditions, be it the scrapped parts or the parts that can be reworked.
-
Startup losses or reduced yield: This refers to the loss through the production of defective parts from any startup until steady production is reached. This can happen after either equipment startup or after the changeovers
21. 7 WASTES
Waste reduction is one of the main prerequisites of lean manufacturing technology.
7 wastes mainly refer to the common types of waste generated in the manufacturing company. Identifying them enables the reduction of this type of waste generation, which will help increase the quality of the product, and customer value and maximise the overall efficiency of the production system.
Seven types of waste include:
-
Overproduction: Overproduction is the reason for almost all the other types of mudas being produced. Overproduction includes creating larger quantities of products or making them even before the customer needs them. Overproduction category wastes will have significant impacts like investing a lot of capital in the unused inventory, the storage cost, wasted raw materials and even can cause environmental concerns.
-
Inventory: This includes the waste produced by the excess inventory, more than what is needed for the actual production. This can also cause the extra cost of storage, capital being stuck in the unused machinery, environmental concerns, transportation costs etc.
-
Waiting: Waiting refers to the time lost being steps of production where one step may slow down due to specific reasons and will, in turn, slow down the entire system and affect the system's productivity. The wastes include wasted labour, energy, and machinery being damaged due to inefficient workflow.
-
Transportation: Transportation costs add no value to the product but is only an additional cost that has to be borne by the manufacturers. A plant closer to the production line is always beneficial for the manufacturers. It reduces the cost of storage, the risk of products being defective, wasted labour, safety precautions, etc.
-
Overprocessing: Over Processing type of waste includes the excessive cost added to the process by using excessive equipment and techniques that a much simpler process or machinery could do. Excessive labour, wastage of energy and raw materials are the concerns here.
-
Motion: Wastage of motion can add to the waste, including the human and the inventory motions.
-
Defects: Defects range from any faulty product to any product that is not meeting the customer's expectations. It can cause the loss of the customer, additional cost of storing, repairing or disposing of it etc.
Along with these seven wastes, the waste of unused employee creativity or non utilised talent is the 8th waste. This waste, unlike the others, is not manufacturing process specific but occurs when the manufacturing company fails to ensure the utilisation of the potential talent of the employee.
22. HOSHIN KANRI
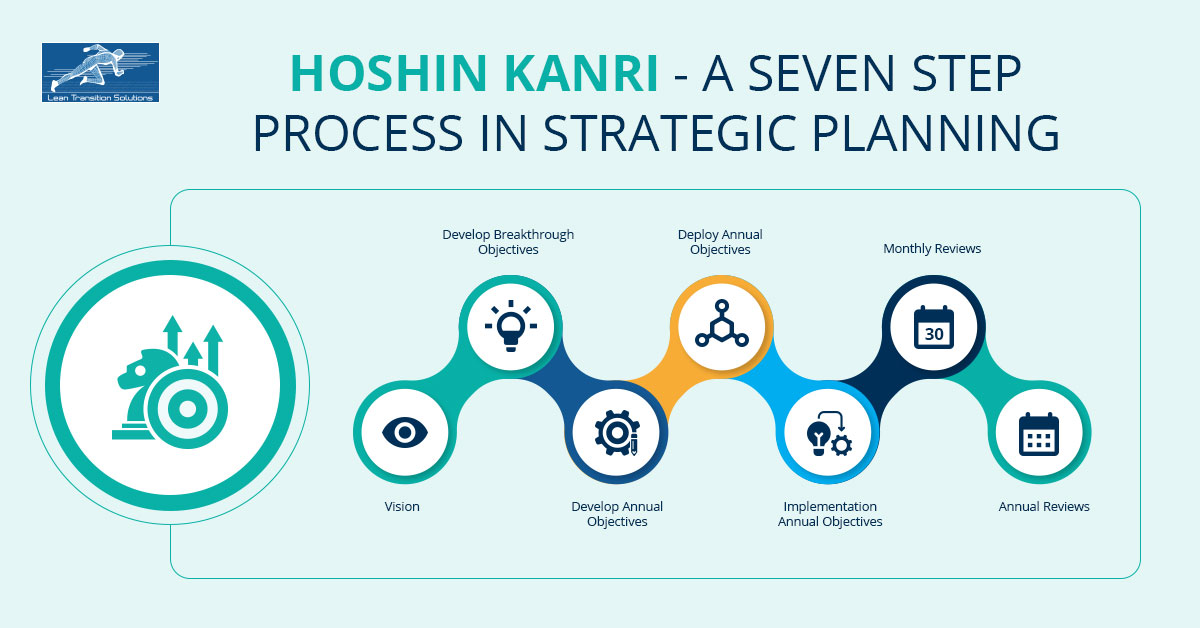
Hoshin Kanri is a seven-step planning process for ensuring that the company's strategy gets executed across the hierarchy. The company goals or the strategic objectives are aligned with the middle management and the plant floor to ensure its proper working. Hoshin Kanri is not a top to down approach. Instead, it is a joint effort from the top management to the workers who agree upon this set goal. Hoshin Kanri ensures that the set strategic objectives are being implemented consistently, which will help reduce waste generation as miscommunication is avoided at every level of work
The seven steps included in the Hoshin Kanri approach include:
-
Setting up an organisational vision: Identifying the current and future goals to be implemented.
-
Developing breakthrough objectives: Key objectives likely to create a competitive edge for the company through its achievement. These breakthrough objectives are more long term objectives and need the effort of everyone included in the process to meet the goals.
-
Establish annual objectives: The goals are broken down into a yearly plan to be completed.
-
Deciding on metres for the measuring of the objectives.
-
Implementation: After the deployment now, the next step is to carry out the actual execution
-
Monthly review: Progress of the plan is checked each month to understand where the improvements need to be done
-
Annual review: Review will be conducted to ensure whether the annual plan objectives have been achieved
The Hoshin Kanri X matrix is a comprehensive visual tool that integrates Balanced Scorecard aspects to facilitate detailed strategic planning. It provides a structured framework for aligning organisational goals and strategies with strategic initiatives, while also highlighting key metrics for improvement. This dynamic template enables organisations to effectively manage their strategic objectives, ensuring alignment with the Balanced Scorecard perspectives of financial, customer, internal processes, and learning and growth. By leveraging the Hoshin Kanri X matrix, businesses can enhance strategic alignment and performance tracking, driving continuous improvement and achieving sustainable success.
23. ROOT CAUSE ANALYSIS
This problem-solving methodology analyses the root cause of the problem instead of finding temporary solutions to fix the issues. The primary benefit of this kind of approach is that it can avoid breakdowns and reduce downtime in the future as the problem is being eliminated at the root level itself. This methodology suggests solving at the root level but does not try to solve it in the entire one go but is done through reiteration.
Root cause analysis occurs in the following steps
-
Identify the root cause of the problem and prevent it from happening in the future.
-
Every problem has one root cause.
-
The issue found is studied, rectified, and shared across the organisation to avoid it.
24. VALUE STREAM MAPPING
Value stream mapping is a visual representation to mark each phase of the production process. With the help of the flow chart, every associated stage of the process is evident and helped in the analysis of elimination of the waste generation, which is the key objective of lean manufacturing. It also makes the process more efficient by reducing time.
Attributes needed for the value stream mapping include
-
Inventory
-
Number of operators involved and the number of shifts worked by them
-
Number of products produced
-
Time taken to make one product
-
Time taken to switch from one product to the next one
-
Total working hours of the company
25. RIGHT FIRST TIME
This lean approach helps get the product right the first time and every time. This does not suggest producing the product correctly but delivering the correct new product to the customer in the first instance itself. Planning and understanding the process is the primary aim involved in this process. The steps included in this:
Track performance: The manufacturing process should be studied in detail so that the defects and shortcomings are understood and identified
Improve performance :Systematic process is included to avoid human errors and increase the system's efficacy so that the product can be delivered right the first time.
Reduce wastes: Waste generation should be reduced, and the Right first-time tools are used to reduce waste generation. The key focus area includes inventory, overproduction, defects and transportation.
Now that we have gone through the major lean tools, we have understood the importance of implementing them in different industries and the various benefits of using them. Lean tools improve quality performance by lowering defects, machine breakdowns and inventories. With greater customer satisfaction and improved employee morale, the company can perform well and compete in the greater competitive markets. These lean tools find their application in almost all industries, manufacturing or logistics, and are customisable according to their requirements. Industry 4.0 has already revolutionised the industrial world, and lagging in the continuous improvement techniques can cost significant losses for enterprises. Lean tools are the need of the hour because the market is throwing out the greater competition to produce maximum out of the minimum resources and make higher profits, which is exactly what lean tools offer.
Start Free Trial
LEAN TRANSITION SOLUTIONS
The Old Vicarage, Pershore Road, Upton Snodsbury, Worcester, Worcestershire, WR7 4NR, United Kingdom.
BLOG
Lean Transition Solution
-
Lean Industry 4.0 Solutions
- TITAN:Computerised Maintenance Management System
- Data Point:Computerised Balanced Scorecard
- Janus: Automated Shop-floor Data Capture System
- T-Card: Integrated Production Planning and Plant Level Execution System
- JDI: Maintenance Automation App
- Maximus: Integrated ERP System
- e-Contractor: Integrated In-house Contractor Management System
- Q-Point: Integrated Quality Management System
- Safety-Point: Integrated Health and Safety Management System
- Lean Assessment: Lean Audit and Assessment System
- Saisho: Lean 5S Audit and Assessment App
- Emergency Response App: To Manage Emergency Situations
-
Leadership 4.0 Solutions
- Your Career Academy(YCA): Learning and Development System
- YCA e-Learning : Management System
- MentorYou(MU): Mentoring App
- Leadership 4.0 : Leadership Transformation Program
- Lean Manufacturing Workshop
- Lean Manufacturing Consulting
- ILM Accredited Green Belt Training and Certification Program
- ILM Accredited Black Belt Training and Certification Program
- Software Development Service
- Resources
- Company
- Contact
