Saisho: Lean 5S Audit and Assessment App
- Enterprise Strategic Planning
- Centralised and Real-time Information
- 5S Audit & Action Plan
- Evaluation of 5S Implementation at the Workplace
- Adopting Lean Paradigm
- Focus on Continuous Improvement
- Developing Lean Structure
- Major Long-term Benefits
- Detailed Reports & Graphs

Saisho: Lean 5S Audit and Assessment App
5S Audit & Audit Creation
- Audit
- Audit Creation
- Performance Analysis
- Increase Productivity
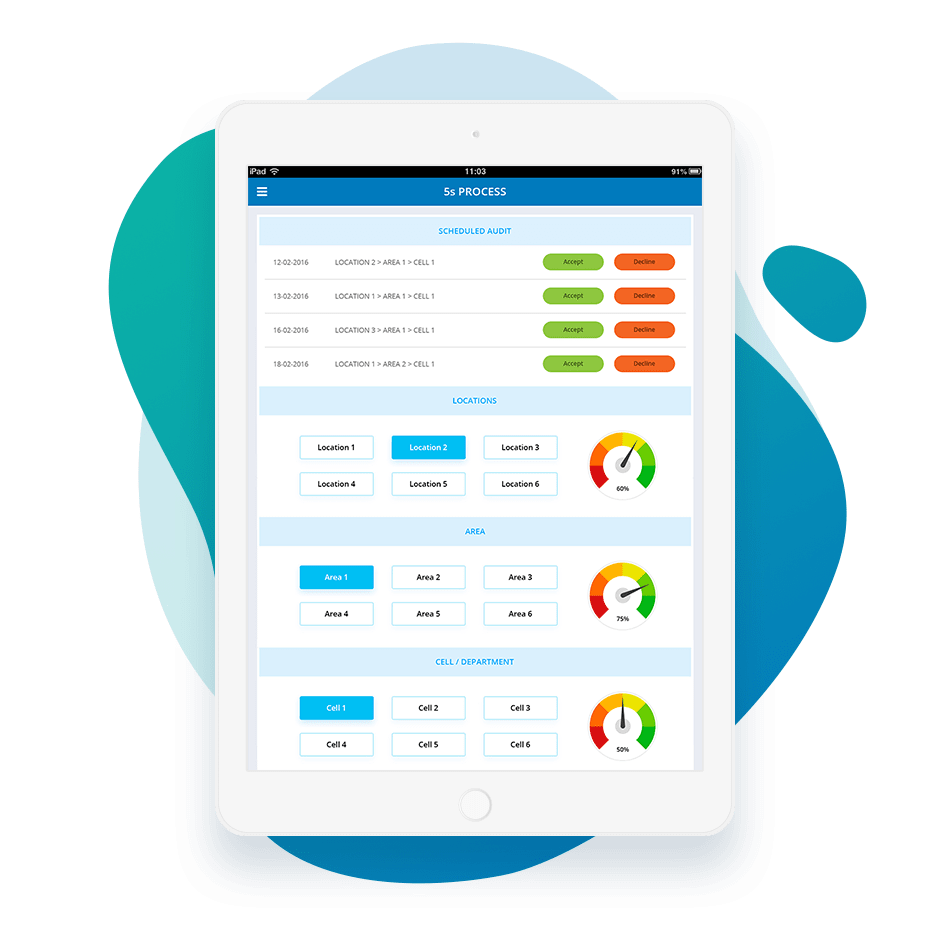
The 5S audit ensures continuous improvement by evaluating the 5S implementation at the organisation. The audit process is agile, efficient, and effective. With a regular audit process, organisations can track the graph of its performance and thereby implement action plans to remove any kind of anomalies. New audits can be created and assigned to employees, including notifications and reminders. As employee engagement increases so does the productivity. The data flow of every audit is simple, organised, and can be tracked easily.
- Continuous Improvement
- Efficient and Effective Audit Process
- Increase Productivity
- Enhance Lean Practices
Audit Questionnaire
- Audit Questions
- Red Tag
- WDGLL
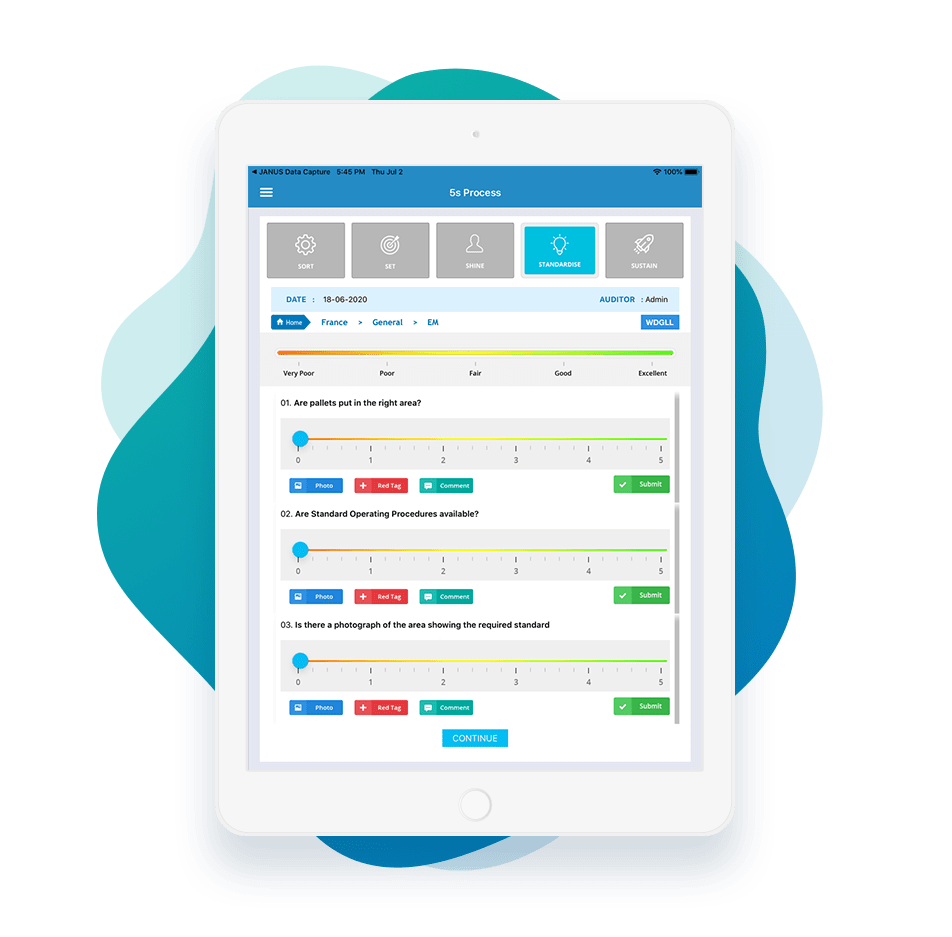
The system users are allowed to create and assign an audit question to a particular area and process. There is no limit to the number of questions. Auditors can create and manage as many as audit questions they want. Users can also add Red Tag and WDGLL images to support their findings.
- Create and Assign Audit Questions
- No Specific Limit for Questions
- Red Tag and WDGLL Images

Initiate an Action Plan
- Initiate Action Plan
- Monitoring
- Access to Previous Audits
Once the audit is done, organisations can work on the action plan to be implemented. Action plans can be assigned to employees and monitored regularly. An effective action plan has a positive impact on the employees and helps them perform better.
Organisations can access all previous audits, check if actions are initiated or pending and check the results.
- Initiate Action Plan and Assign Employees
- Monitor Audit Results
- Taking Preventive Measures
- Access to all Previous Data for Comparison
Safe Working Environment
- Hazard Identification
- Digital Safety Checklist
- Better workplace
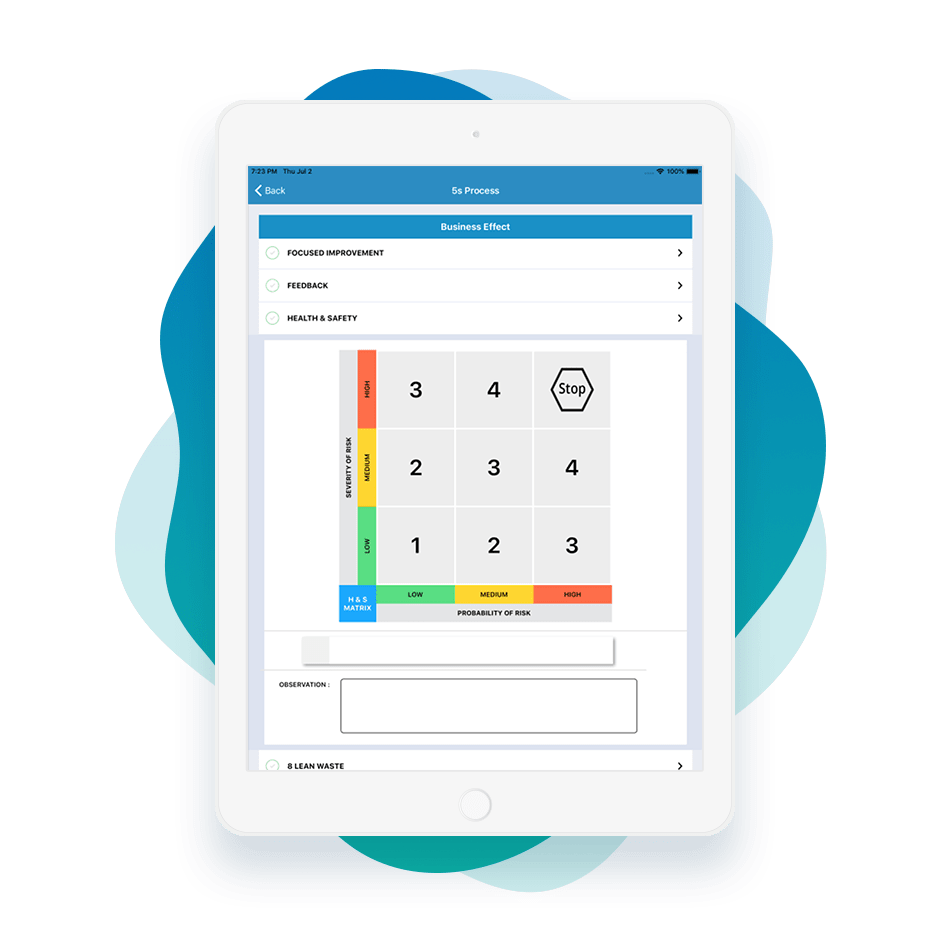
With Saisho, organisations can ensure a safe and secure working environment for their employees. It identifies hazards and sets preventive measures to keep workers safe during those operations. Using a digital safety checklist organisations can identify common warehouse and manufacturing hazards. A well-managed 5S strategy will not only eliminate waste but also improve the daily jobs of every employee. The purpose of 5S is to make a workplace function better by making it an easier place to work.
- Ensure a Safe Working Environment
- Improve Workplace Experience
- Digital Safety Checklist
- Identify Manufacturing Hazards

WDGLL & Red Tag
- WDGLL
- Red Tag
- Easy Access
What Does Good Look Like (WDGLL) and Red Tag photos can be easily stored and accessed later to refer to the preset standards. All red-tagged photos are stored in the red tag library for easier access. The red tags are used to identify unnecessary items that need to be either thrown out, recycled, sold, or relocated. This helps the employees to differentiate items tagged as unwanted.
- Store and Access WDGLL and Red Tag Photos
- Analyse with Preset Standards
- Easy for Employees to Locate Items that are Unwanted
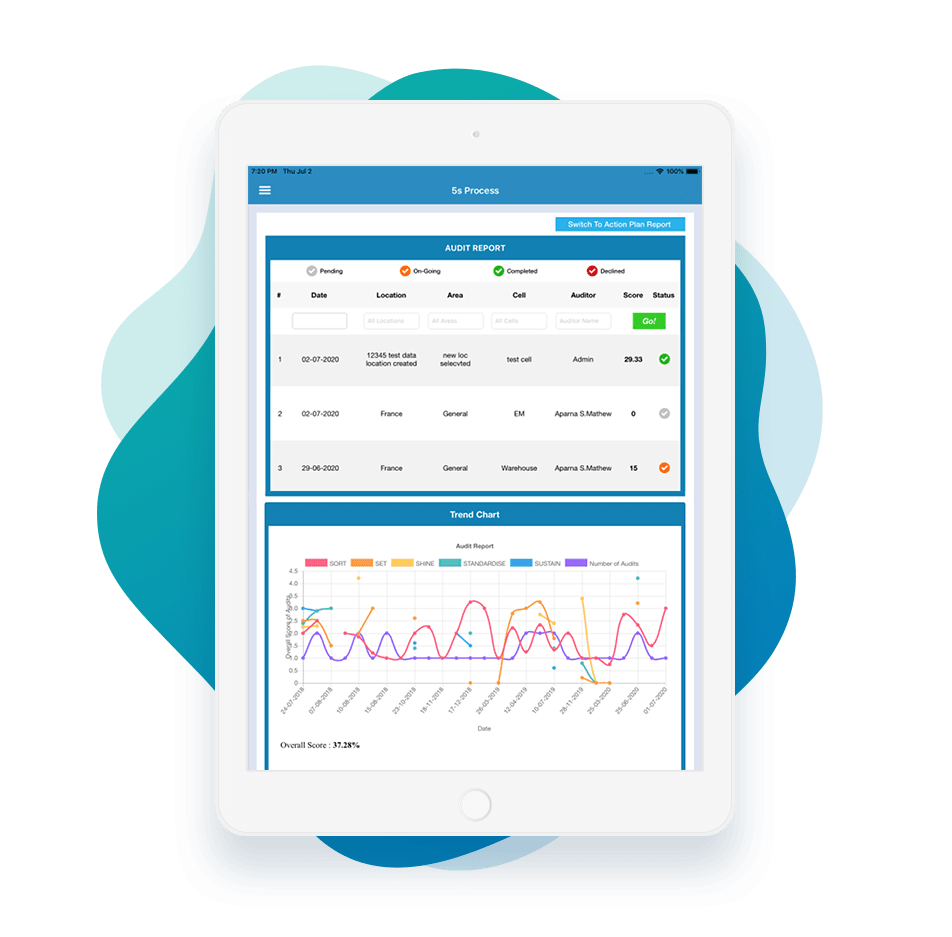
Reports & Graphs
- Report Summary
- Auto-Generated Reports
At the end of every audit, a report summary, as well as a trend chart, is generated. Summary reports enable users to scroll through and view previous audit results and data. Employees can see audits that have been completed or missed. Data and charts are collated and auto-generated to enable the user and management to see live data and data trends at an instance. The users can forward these reports to other personal or company mail accounts. Organisations can evaluate the impact 5S program with performance reports.
- Auto-Generated Audit Reports
- Complete Analysis of Audit Reports
- Evaluate the Impact of the 5S Program within the Organisation
- Easy Mailing of the Audit Reports
